A graph view for Wikipedia
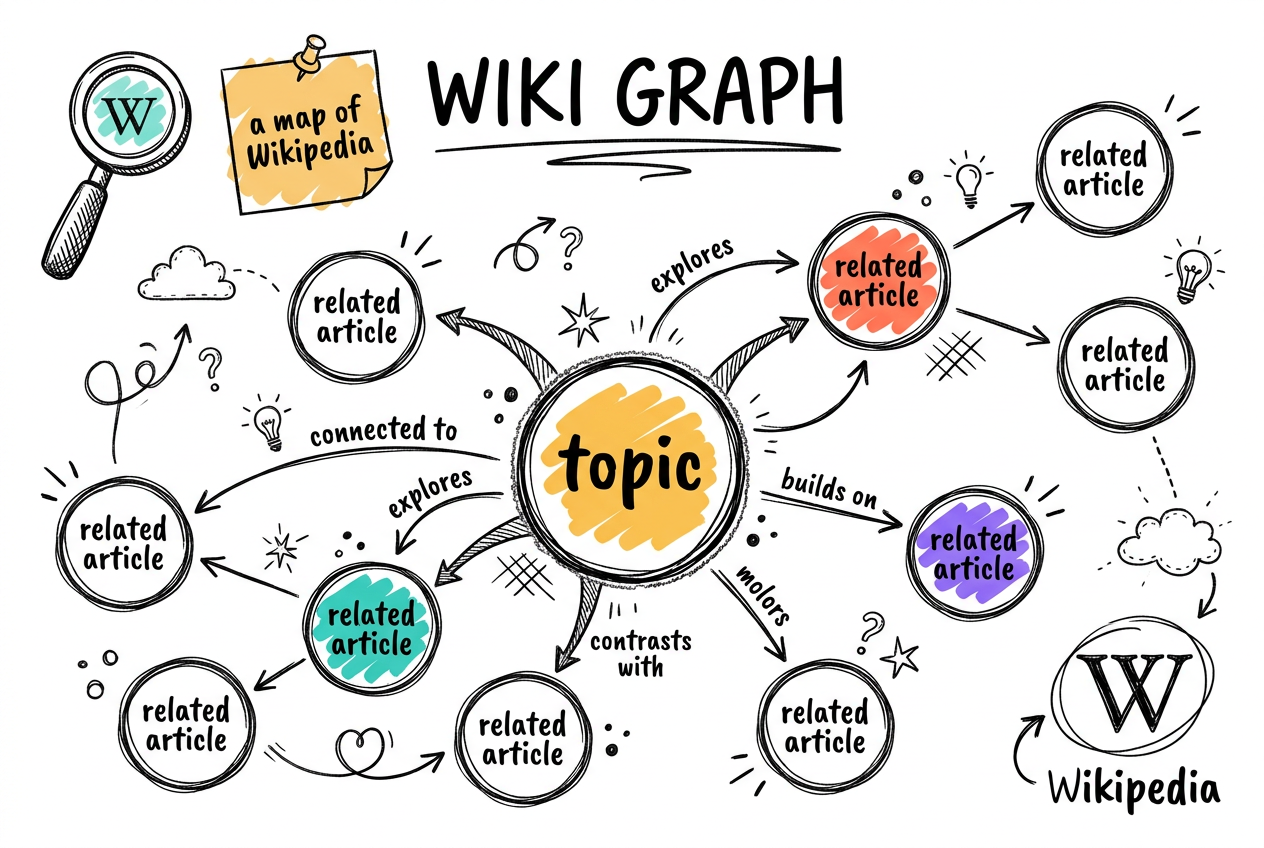
Wiki Graph turns Wikipedia into a map you can wander. You type any topic, it drops that article in the middle as a node, then fans out the articles it is related to as a force-directed graph you can pan and zoom around. Instead of reading one page at a time, you see the shape of a subject, the cluster of ideas around it, and the paths between them. It is a knowledge-graph toy that runs entirely in your browser.
- Type a topic, get a living map of related articles.
- Built on anvaka's vs graph engine, forked from blinpete/wiki-graph.
- No login, no backend, no API keys. Just a static web page.
Type, fan out, click, re-center, repeat
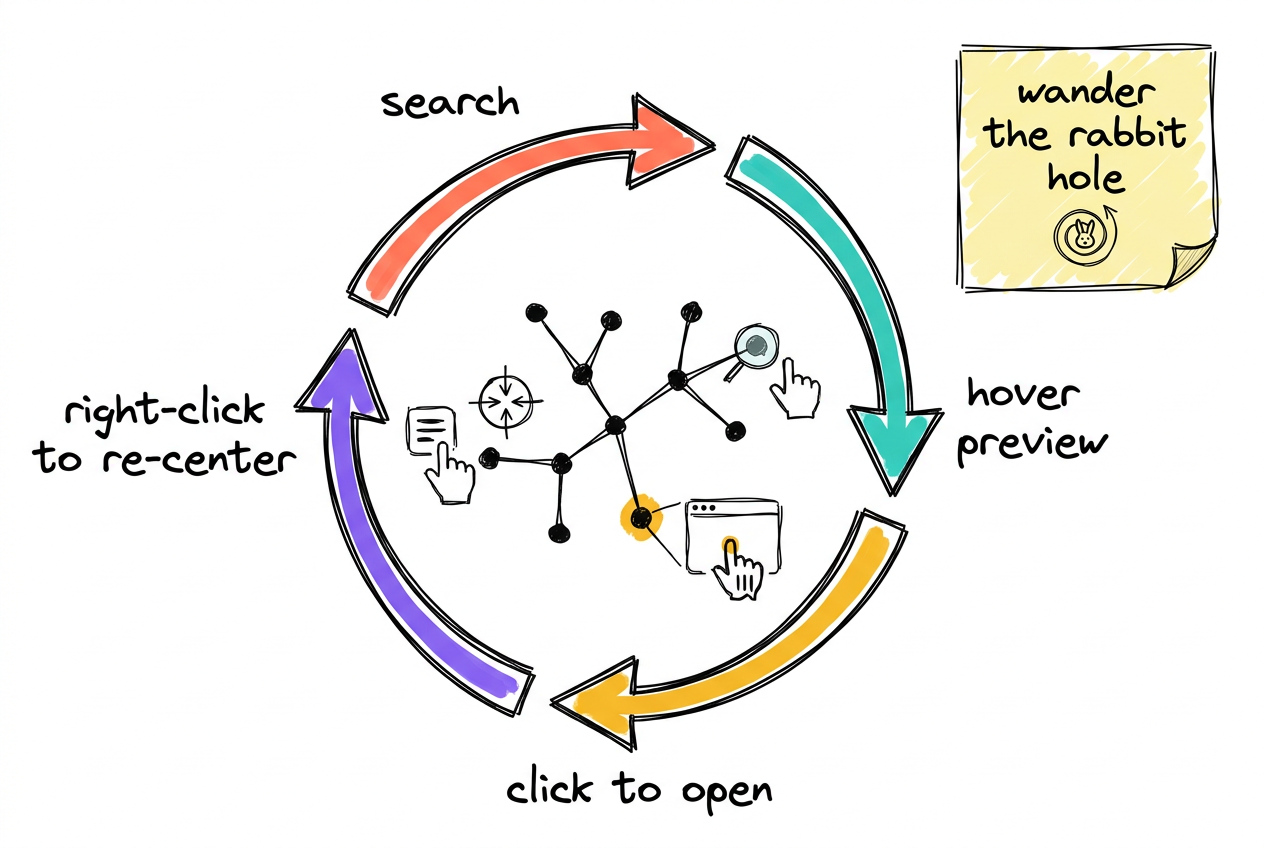
The whole experience is one tight loop. Search a topic and it becomes the center node with its related articles bursting out around it. Hover any node for a preview card (thumbnail plus the intro paragraph). Left-click opens that article on Wikipedia. Right-click is the magic move: it re-centers the graph on that node and fans out ITS neighbors, so you keep walking outward from idea to idea without ever losing the map.
- Hover = preview tooltip with image and summary.
- Left-click = open the full Wikipedia article in a new tab.
- Right-click = re-center the graph on that node and explore deeper.
- Pan and zoom the whole canvas with drag and scroll.
Force-directed layout, vendored from anvaka's vs
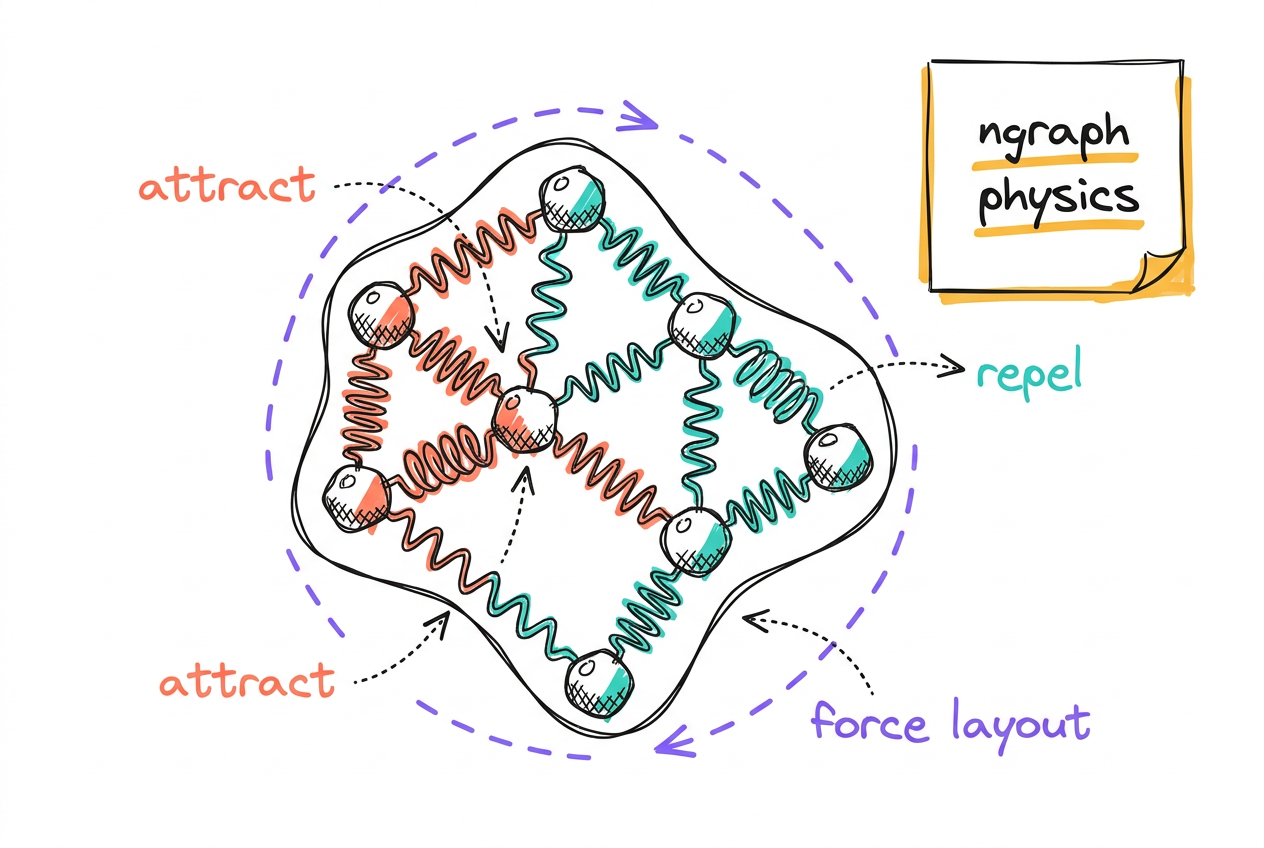
The graph is not a static image. Every node is a little body in a physics simulation: connected articles attract, everything else repels, and the layout settles into a readable shape on its own. That engine is anvaka's vs core, copied straight into the project (src/core-anvaka-vs) rather than installed, so it can be tuned. It leans on the ngraph family for the force layout and spanning trees, panzoom for the canvas, and delaunator plus flatbush to keep labels from overlapping.
- ngraph.forcelayout runs the physics that positions every node.
- panzoom handles smooth drag-to-pan and scroll-to-zoom.
- delaunator + flatbush remove label overlaps as it settles.
- The vs core is vendored in-repo, so it is fully tweakable.
Three live Wikipedia endpoints, zero backend
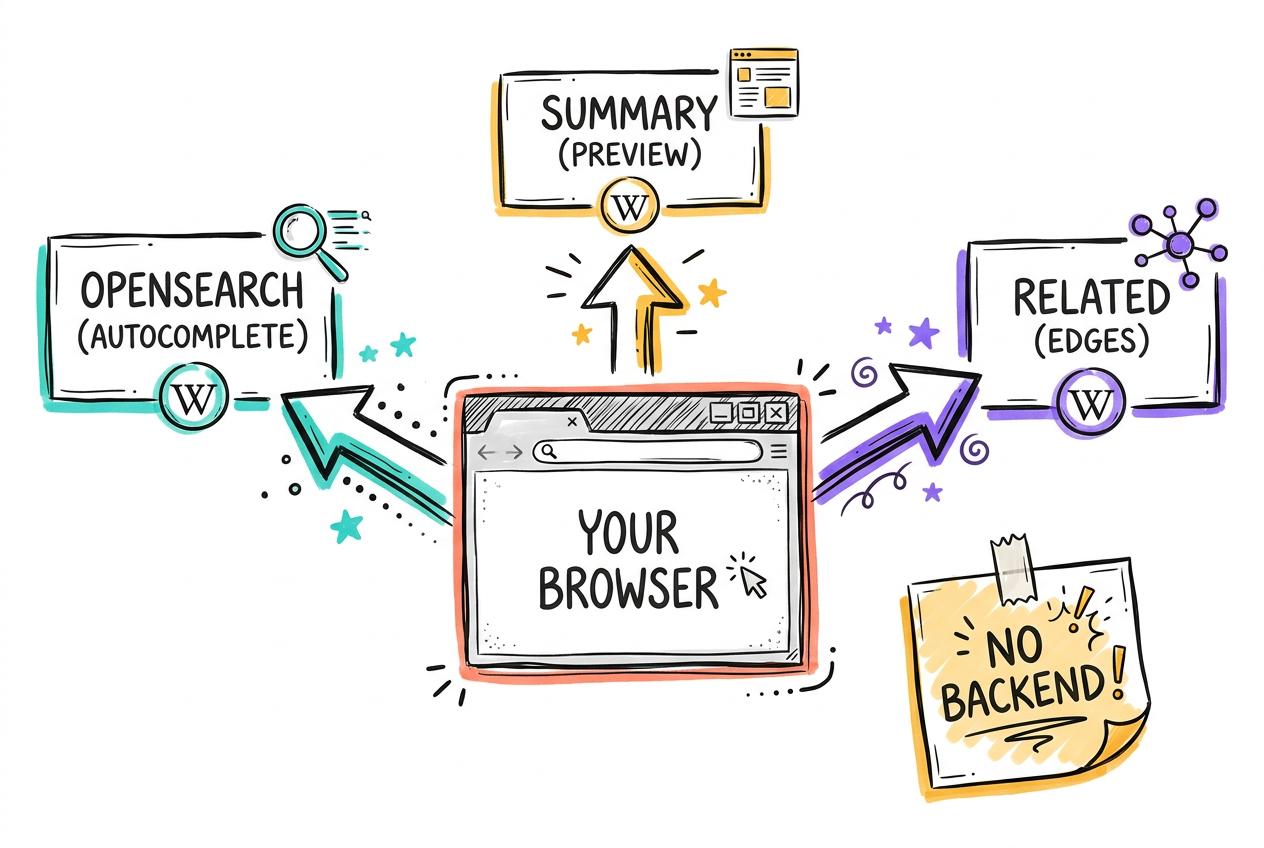
There is no database and no server of its own. Everything is fetched live from Wikipedia's public APIs straight from your browser. Autocomplete in the search box comes from the MediaWiki opensearch API. Each node's preview card (image plus intro) comes from the Wikimedia REST page summary endpoint. And the edges, the actual relationships that make the graph a graph, come from Wikimedia's experimental related-pages endpoint. That is the whole data layer.
- Autocomplete: MediaWiki Action API (opensearch).
- Node previews: Wikimedia REST /page/summary.
- Edges / relationships: Wikimedia REST /page/related.
- All client-side. CORS handled with origin=* on the requests.
https://en.wikipedia.org/api/rest_v1/page/related/{TITLE}https://en.wikipedia.org/api/rest_v1/page/summary/{TITLE}Svelte + Vite + TypeScript, shipped as a static site
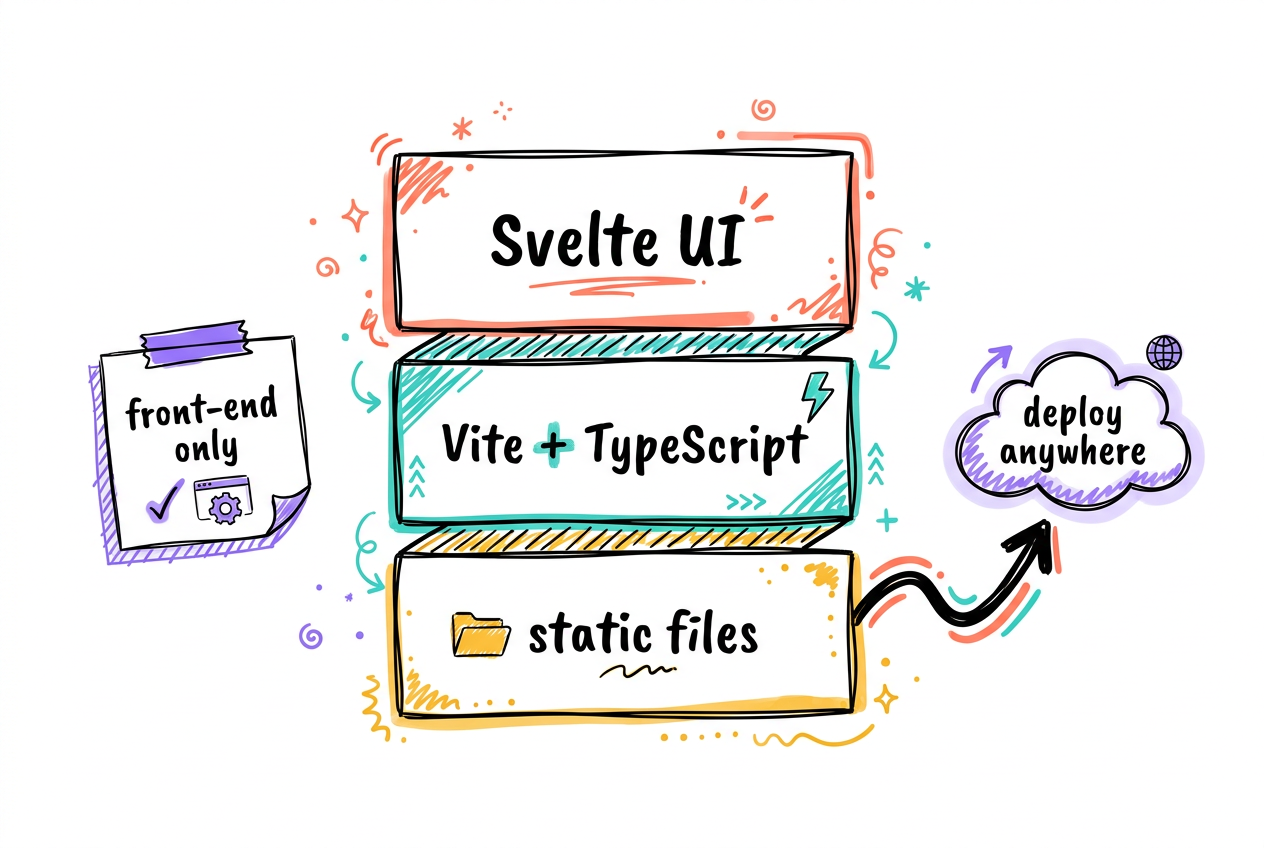
It is a lean front-end-only app. Svelte 3 drives the UI, Vite bundles it, and TypeScript keeps the API responses honest. Because there is no backend, the build output is just static files that drop onto any host (the original publishes to GitHub Pages; this explainer's sibling deploys just as easily to Vercel). That simplicity is the point: the heavy lifting is the graph math and the Wikipedia APIs, so the app itself stays tiny.
- Svelte 3 for the components, Vite for the dev server and build.
- TypeScript types the Wikipedia summary and related responses.
- Static output: no server, no env, deploy to Pages or Vercel.
Clone, install, and explore locally
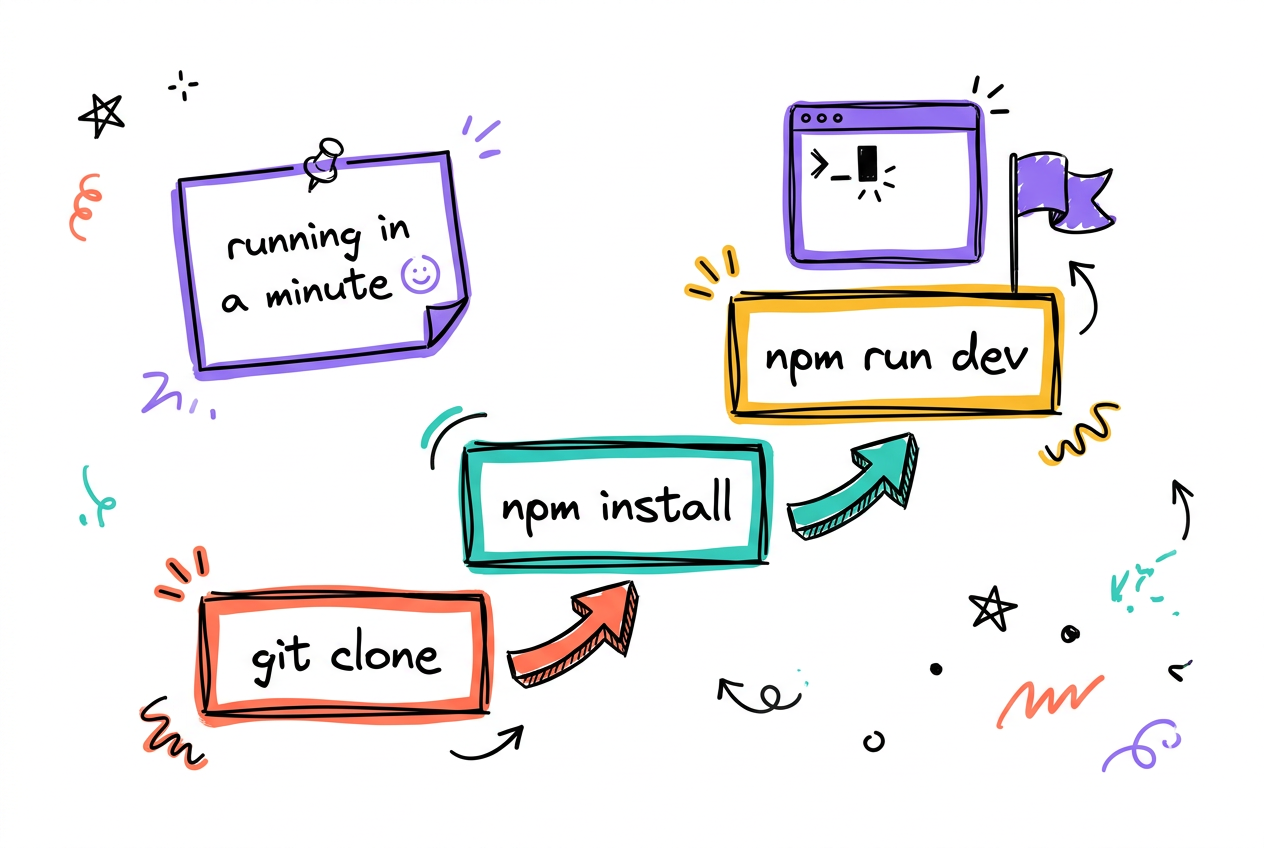
It runs like any Vite project. Clone the repo, install, and start the dev server. You can also deep-link straight into a graph: the app reads its state from the URL, so a lang and a query parameter will load a specific topic on first paint. Switch languages to explore other Wikipedias entirely (the related-pages graph is per-language).
- npm install, then npm run dev for the local server.
- npm run build outputs the static site to dist/.
- URL params (lang, query) deep-link to a specific graph.
git clone https://github.com/coryhubbell/wiki-graph.git
cd wiki-graph
npm install
npm run dev?lang=en&query=Erwin%20Schr%C3%B6dingerWordle mode: guess the graph
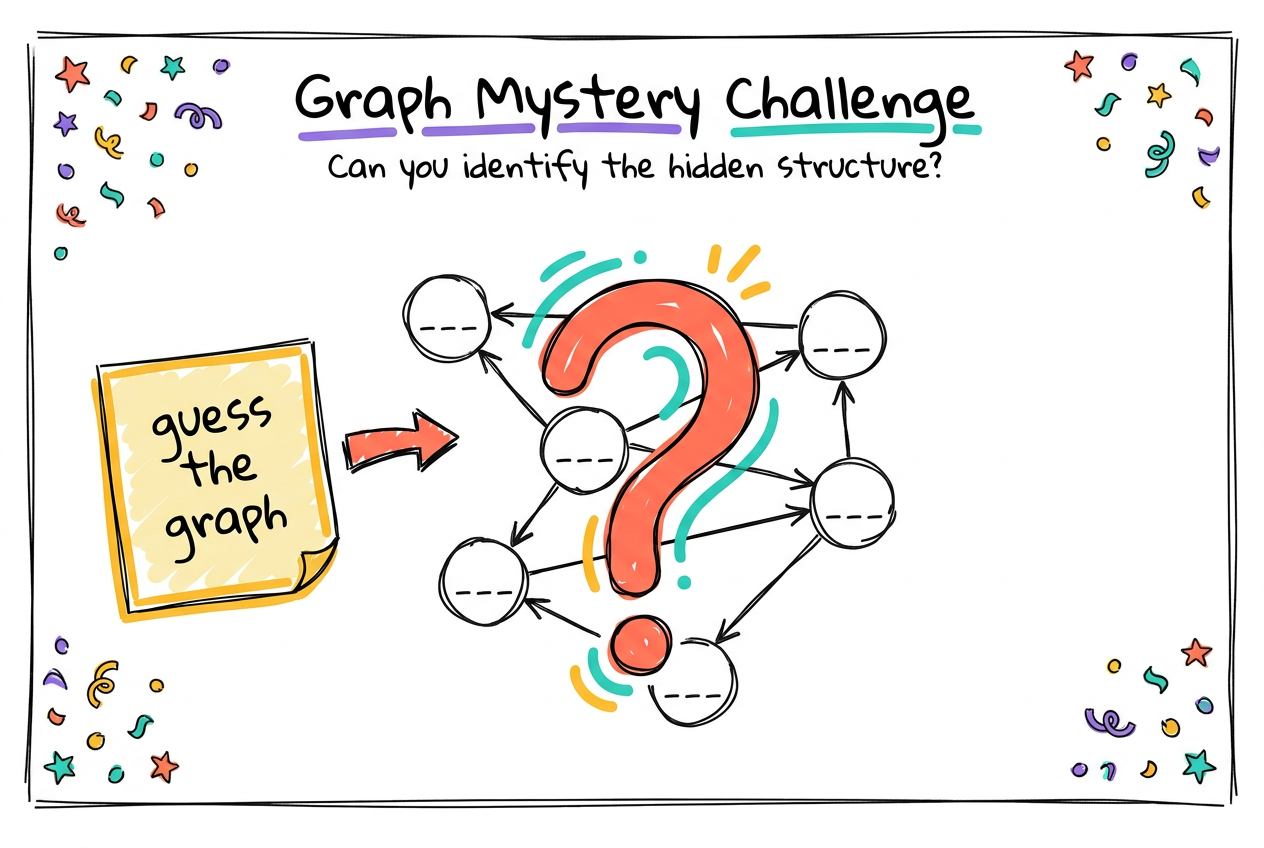
There is a playful toy baked in. Flip on Wordle mode and the node labels turn into dashed placeholders, hiding the article names. You try to guess what the graph is about from its shape and connections alone. Solve it and the screen throws confetti. It is not core to what Wiki Graph does, just a charming reminder that a knowledge graph has a recognizable silhouette even before you read a single label.
- Labels become dashes; you guess the topic from structure.
- Correct guess triggers a confetti celebration.
- Toggle it on and off from the corner menu. Pure play.